methylize documentation
Getting Started
methylize is a python package for analyzing output from Illumina methylation arrays. It complements methylprep and methylcheck and provides methods for computing differentially methylated probes and regions, and annotating these regions with the UCSC Genome Browser. View on ReadTheDocs.


methylize is part of the methylsuite
methylize is part of the methylsuite of python packages that provide functions to analyze DNA methylation data from Illumina’s Infinium arrays (27k, 450k, and EPIC, as well as mouse arrays). This package is focused on analysis of processed methylation data, such as EWAS using Manhattan and Volcano plots.
methylize functions are designed to work with a minimum of knowledge and specification required. But you can always override the “smart” defaults with custom settings if the default settings don’t work for your data. The entire methylsuite is designed in this format: to offer ease of use while still maintaining flexibility for customization as needed.
Methylsuite package components
You should install all three components, as they work together. The parts include:
methylprep: for processingidatfiles or downloading GEO datasets from NIH. Processing steps include- infer type-I channel switch
- NOOB (normal-exponential convolution on out-of-band probe data)
- poobah (p-value with out-of-band array hybridization, for filtering low signal-to-noise probes)
- qualityMask (to exclude historically less reliable probes)
- nonlinear dye bias correction (AKA signal quantile normalization between red/green channels across a sample)
- calculate beta-value, m-value, or copy-number matrix
- large batch memory management, by splitting it up into smaller batches during processing
methylcheck: (this package) for quality control (QC) and analysis, including- functions for filtering out unreliable probes, based on the published literature
- Note that
methylprep processwill exclude a set of unreliable probes by default. You can disable that using the –no_quality_mask option from CLI.
- Note that
- sample outlier detection
- array level QC plots, based on Genome Studio functions
- a python clone of Illumina’s Bead Array Controls Reporter software (QC)
- data visualization functions based on
seabornandmatplotlibgraphic libraries. - predict sex of human samples from probes
- interactive method for assigning samples to groups, based on array data, in a Jupyter notebook
- functions for filtering out unreliable probes, based on the published literature
methylizeprovides more analysis and interpretation functions- differentially methylated probe statistics (between treatment and control samples)
- volcano plots (which probes are the most different?)
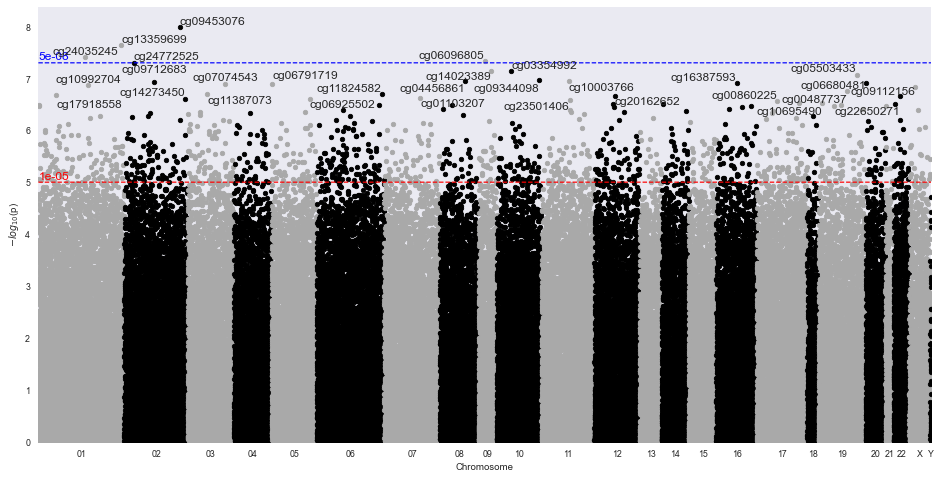
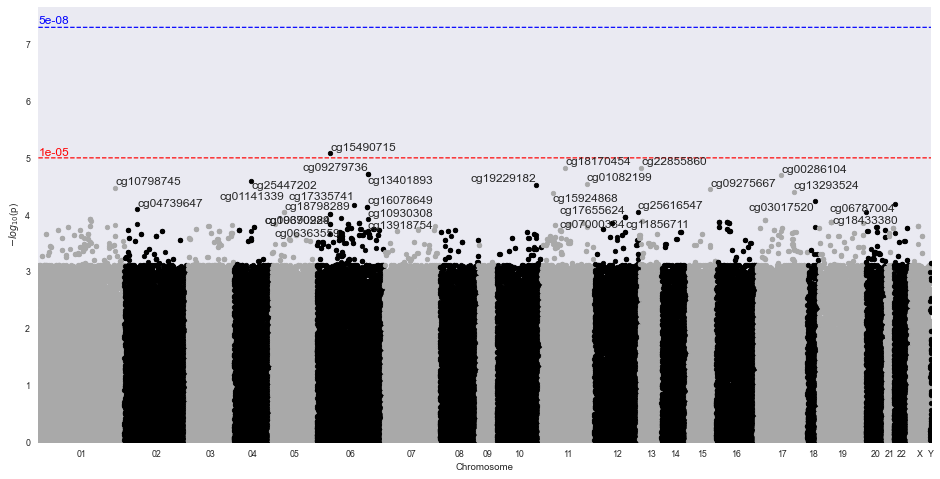
- manhattan plots (where in genome are the differences?)
Table of Contents
Installation
pip3 install methylize
Installation will also install the other parts of the methylsuite (methylprep and methylcheck) if they are not already installed.
- If progress bar is missing:
- If you don’t see a progress bar in your jupyterlab notebook, try this:
- conda install -c conda-forge nodejs
- jupyter labextension install @jupyter-widgets/jupyterlab-manager
Methylize Package
The methylize package contains both high-level APIs for processing data from local files and low-level functionality allowing you to analyze your data AFTER running methylprep and methylcheck. For greatest usability, import methylize into a Jupyer Notebook along with your processed sample data (a DataFrame of beta values or m-values and a separate DataFrame containing meta data about the samples).
Methylize allows you to run linear or logistic regression on all probes and identify points of interest in the methylome where DNA is differentially modified. Then you can use these regression results to create volcano plots and manhattan plots.
Sample Volcano Plot
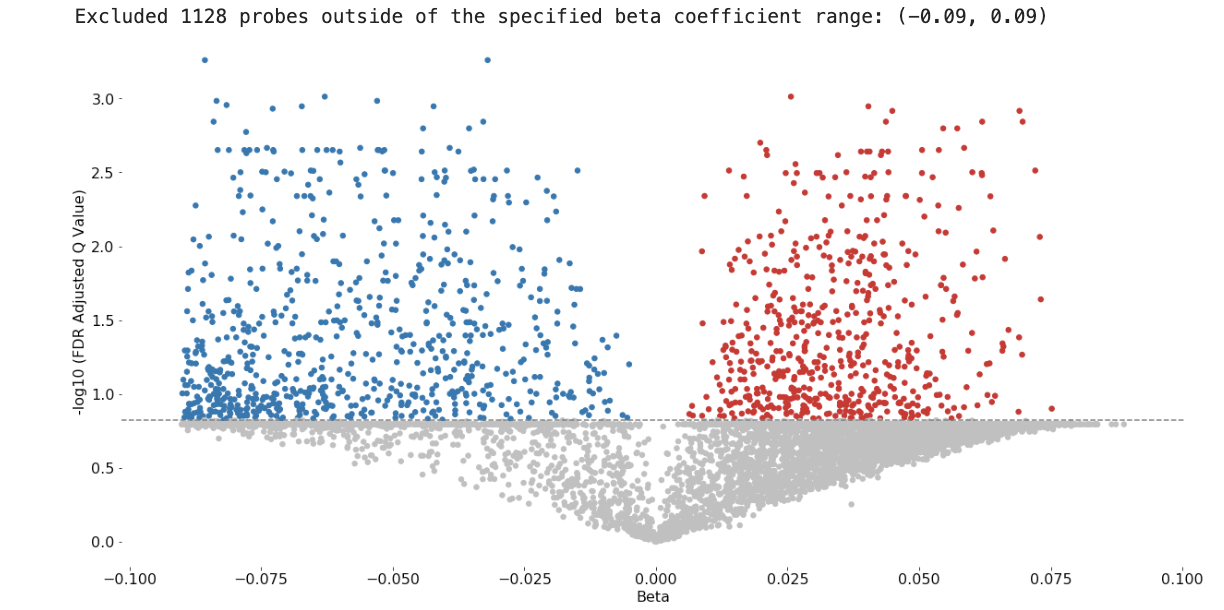
Customizable: Plot size, color palette, and cutoff p-value lines can be set by the user. Exporting: You can export all probe statistics, or just the significant probes as CSV or python pickled DataFrame.
Differentially methylated position/probe (DMP) detection
The diff_meth_pos(meth_data, phenotypes) function searches for individual differentially methylated positions/probes
(DMPs) by regressing methylation beta values or M-values for each sample at a given
genomic location against the phenotype data for those samples.
Phenotypes
Can be provided as
- a list of strings,
- integer binary data,
- numeric continuous data
- pandas Series, DataFrame or numpy array
Only 2 phenotypes are allowed with logistic regression. Use Linear regression with numeric (measurement) phenotypes like age or time. You can pass in the GEO meta DataFrame associated with a dataset along with column=<columnname> kwarg. The order of the items in the phenotype should match the order of samples in the beta values or M-values.
Covariates are also supported for logistic (but not linear) regression. Pass in covariates=True to treat all other columns in a phenotype DataFrame as covariates, or pass in a list of column names to specify specific parts of the DataFrame. Note that supplying too many covariates for small sample sizes will lead to most probes failing with Linear Algebra or Perfect Separation errors.
For details on all of the other adjustable input parameters, refer to the API for diff_meth_pos()
Returns
A pandas dataframe of regression statistics with one row for each probe
and these columns:
- `Coefficient`: regression coefficient
- `StandardError`: standard error
- `95%CI_lower`: lower limit of the coefficient's 95% confidence interval
- `95%CI_upper`: upper limit of the coefficient's 95% confidence interval
- `PValue`: p-value: phenotype group A vs B - likelihood that the difference is significant for this probe/location
- `Rsquared`: proportion (0 to 1) of probe variance explained by your phenotype. Linear Regression Only.
- `FDR_QValue`: p-values corrected for multiple comparisons using the Benjamini-Hochberg FDR method. The False Discovery Rate (FDR) corrected p-values will remain comparable, regardless of the number of additional comparisons (probes) you include.

If a `q_cutoff` is specified, only probes with significant q-values less than the cutoff will be returned in the DataFrame.
Differentially methylated regions (DMR)
Pass in your diff_meth_pos (DMP) stats results DataFrame as input, and it will calculate and annotate differentially methylated regions (DMR) using the combined-pvalues pipeline. This function returns list of output files.
- calculates auto-correlation
- combines adjacent p-values
- performs false discovery rate (FDR) adjustment
- finds regions of enrichment (i.e. series of adjacent low p-values)
- assigns significance to those regions
- annotates significant regions with possibly relevant nearby Genes,
  using the UCSC Genome Browser Database
- annotates candidate genes with expression levels for the sample tissue type,
  if user specifies the sample tissue type.
- returns everything in a CSV that can be imported into other Genomic analysis packages.
For more details on customizing the inputs and outputs, see API for the diff_meth_regions(stats, array_type) function.
Loading processed data
Assuming you previously used methylprep to process a data set like this:
python -m methylprep -v process -d GSE130030 --betas
This creates two files, beta_values.pkl and sample_sheet_meta_data.pkl. You can load both in methylize like this:
Navigate to the folder where methylrep saved its processed files, and start a python interpreter:
>>>import methylcheck
>>>data, meta = methylcheck.load_both()
INFO:methylize.helpers:loaded data (485512, 14) from 1 pickled files (0.159s)
INFO:methylize.helpers:meta.Sample_IDs match data.index (OK)
Or if you are running in a notebook, specify the path:
import methylcheck
data, meta = methylcheck.load_both('<path_to...>/GSE105018')
This also validates both files, and ensures that the Sample_ID column in meta DataFrame aligns with the column names in the data DataFrame.
Contents:
- Differentially methylated regions (DMR) in methylize
- Methylize Walkthrough
- Example: Differentially methylated regions – GSE69852
- All data, logistic regression
- API Reference
- methylprep package
- methylcheck package
- Release History