Demonstrating how to filter probes before analysis
[1]:
import numpy as np
import pandas as pd
import math
import time
[54]:
import methylcheck
# loading previously processed data from methylprep
meta = pd.read_pickle('~/GEO/test_pipeline/GSE49618/sample_sheet_meta_data.pkl')
print(meta.head())
test = pd.read_pickle('~/GEO/test_pipeline/GSE49618/m_values.pkl')
print(test.shape)
test2 = methylcheck.exclude_sex_control_probes(test, '450k', verbose=True)
sketchy_probes_list = methylcheck.list_problem_probes('450k')
test3 = methylcheck.exclude_probes(test2, sketchy_probes_list)
  Cheez BuffyCoat  Sentrix_ID Sentrix_Position Sample_Group Sample_Name  \
0     1         0  6285625091           R05C01         None   8.24 CD34
1     1         0  7796806148           R03C02         None    7.25 PMN
2     1         0  7796806148           R01C02         None   7.25 PROS
3     1         0  6285625091           R06C02         None     9.1 PMN
4     2         0  6285625091           R03C01         None   8.10 CD19

  Sample_Plate Sample_Type Sub_Type Sample_Well Pool_ID      GSM_ID Control  \
0         None       Blood    Whole        None    None  GSM1185586   False
1         None       Blood    Whole        None    None  GSM1185602    True
2         None       Blood    Whole        None    None  GSM1185600   False
3         None       Blood    Whole        None    None  GSM1185593   False
4         None       Blood    Whole        None    None  GSM1185584   False

                      Sample_ID
0  GSM1185586_6285625091_R05C01
1  GSM1185602_7796806148_R03C02
2  GSM1185600_7796806148_R01C02
3  GSM1185593_6285625091_R06C02
4  GSM1185584_6285625091_R03C01
(485512, 21)
Array 450k: Removed 11648 sex linked probes and 916 internal control probes from 21 samples. 473864 probes remaining.
Discrepancy between number of probes to exclude (12564) and number actually removed (11648): 916
It appears that your sample had no control probes, or that the control probe names didn't match the manifest (450k).
Of 473864 probes, 334500 matched, yielding 139364 probes after filtering.
[55]:
%load_ext autoreload
%autoreload 2
from methylize import diff_meth_pos, volcano_plot, manhattan_plot
The autoreload extension is already loaded. To reload it, use:
  %reload_ext autoreload
[56]:
#Install joblib module for parallelization
import sys
!conda install --yes --prefix {sys.prefix} joblib
Collecting package metadata (current_repodata.json): done
Solving environment: done

# All requested packages already installed.
Testing logistic regression
[57]:
##Run a logistic regression on the methylation data. Must have exactly two phenotypes for logistic regression.
test_results = diff_meth_pos(
    test3,
    meta, column='Cheez',
    regression_method="logistic",
    export=False)
Additional parameters: {'column': 'Cheez', 'export': False}
Warning: meth_data was transposed: (21, 139364)
All samples with the phenotype (2) were assigned a value of 0 and all samples with the phenotype (1) were assigned a value of 1 for the logistic regression analysis.
Testing Manhattan plot visualizations
[58]:
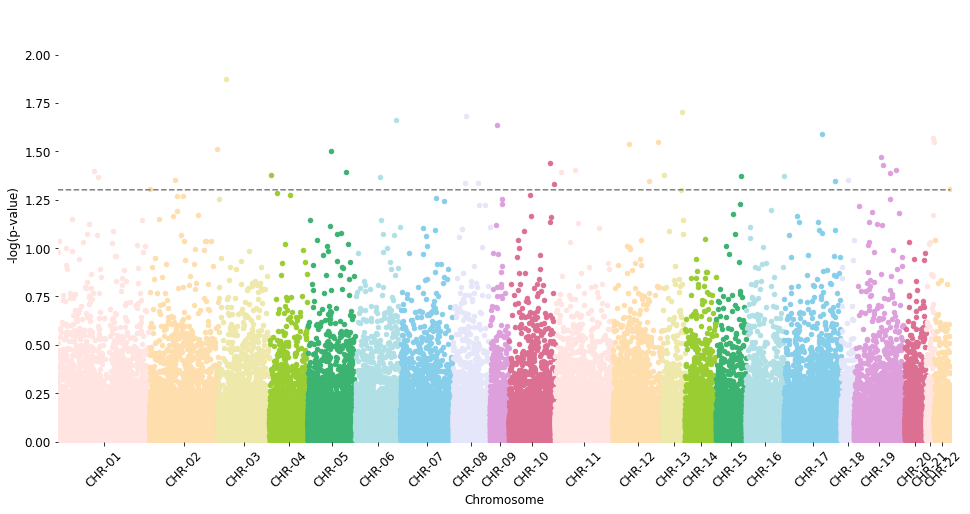
manhattan_plot(test_results, cutoff=0.05, palette='default', save=False) #, label_prefix='')
NaNs: 8961
Warning: 8961 probes were removed because their names don't match methylize's lookup list
Total probes to plot: 130403
CHR-01 13398 | CHR-02 10020 | CHR-03 7510 | CHR-04 5574 | CHR-05 6990 | CHR-06 6567 | CHR-07 7623 | CHR-08 5468 | CHR-09 2771 | CHR-10 6680 | CHR-11 8489 | CHR-12 7194 | CHR-13 3365 | CHR-14 4528 | CHR-15 4345 | CHR-16 5577 | CHR-17 8297 | CHR-18 1947 | CHR-19 7343 | CHR-20 3115 | CHR-21 1238 | CHR-22 2364
p-value line: 1.3010299956639813
Testing linear regression
[59]:
# Run a linear regression on the methylation data versus age of sample
test_results2 = diff_meth_pos(test3, #test_M_values_T.sample(60000, axis=1), #.iloc[:,:], # ALL probes. slow!
                              meta, column='Cheez',
                              regression_method="linear")
Additional parameters: {'column': 'Cheez'}
Warning: meth_data was transposed: (21, 139364)
[62]:
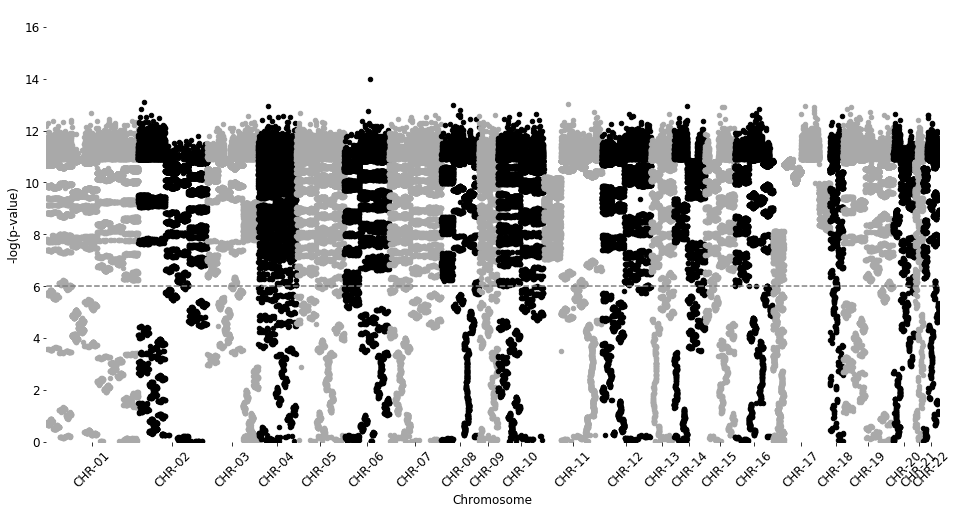
manhattan_plot(test_results2, cutoff=0.000001, palette='Gray3', save=False)
Total probes to plot: 130403
CHR-01 13398 | CHR-02 10020 | CHR-03 7510 | CHR-04 5574 | CHR-05 6990 | CHR-06 6567 | CHR-07 7623 | CHR-08 5468 | CHR-09 2771 | CHR-10 6680 | CHR-11 8489 | CHR-12 7194 | CHR-13 3365 | CHR-14 4528 | CHR-15 4345 | CHR-16 5577 | CHR-17 8297 | CHR-18 1947 | CHR-19 7343 | CHR-20 3115 | CHR-21 1238 | CHR-22 2364
p-value line: 6.0
Testing Volcano plot visualizations
[63]:
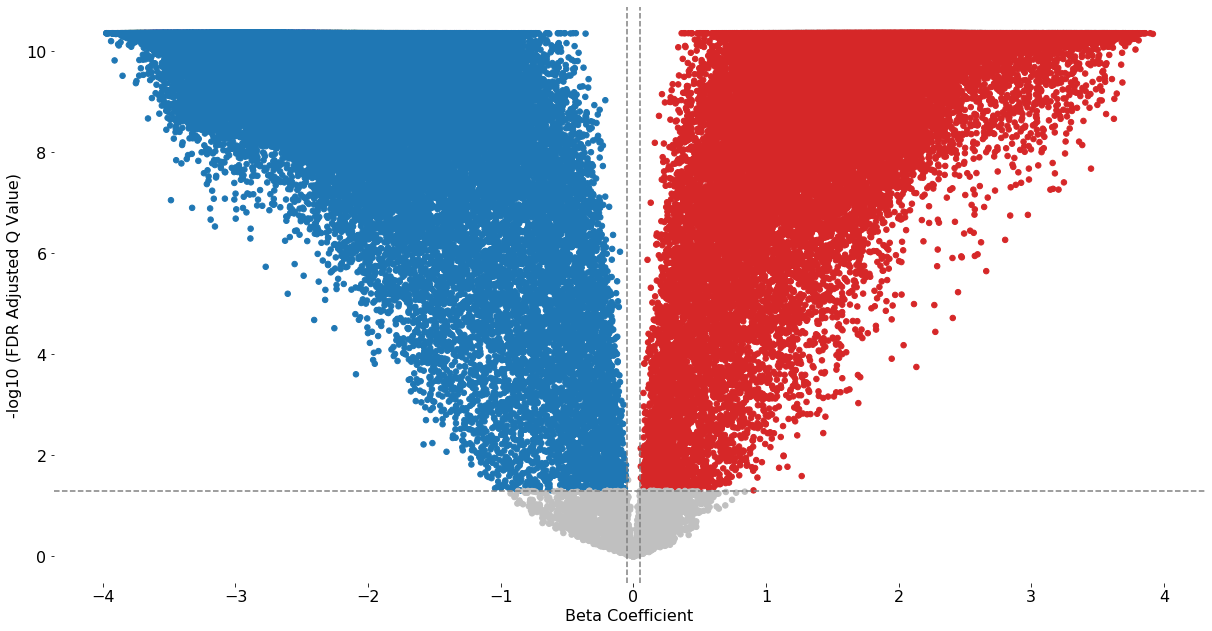
volcano_plot(test_results2, fontsize=16, cutoff=0.05, beta_coefficient_cutoff=(-0.05,0.05), save=False)
Excluded 801 probes outside of the specified beta coefficient range: (-0.05, 0.05)
[ ]:
[ ]: