Differentially methylated position (DMP) regression and visualization
[1]:
import numpy as np
import pandas as pd
import math
import time
import methylprep
import methylcheck
[2]:
%load_ext autoreload
%autoreload 2
from methylize import diff_meth_pos, volcano_plot, manhattan_plot
[3]:
#Install joblib module for parallelization
import sys
!conda install --yes --prefix {sys.prefix} joblib
Collecting package metadata (current_repodata.json): done
Solving environment: done

# All requested packages already installed.
[4]:
# load a processed dataset and the phenotype list per sample.
# in CLI I ran `python -m methylprep process -d GSE69852_copy --betas --m_value to make these files.
betas = pd.read_pickle('../methylize/data/GSE69852_beta_values.pkl')
m_values = pd.read_pickle('../methylize/data/GSE69852_m_values.pkl')
betas.head()
#m_values.head()
[4]:
| 9247377093_R02C01 | 9247377093_R03C01 | 9247377093_R06C02 | 9247377085_R04C02 | 9247377093_R05C01 | 9247377093_R02C02 | |
|---|---|---|---|---|---|---|
| IlmnID | ||||||
| cg00035864 | 0.236234 | 0.287561 | 0.318016 | 0.308176 | 0.239339 | 0.161795 |
| cg00061679 | 0.427194 | 0.395514 | 0.456510 | 0.525169 | 0.523010 | 0.549533 |
| cg00063477 | 0.929039 | 0.927137 | 0.940222 | 0.932739 | 0.930215 | 0.931468 |
| cg00121626 | 0.481058 | 0.357316 | 0.328793 | 0.330045 | 0.403873 | 0.313132 |
| cg00223952 | 0.044029 | 0.040062 | 0.038420 | 0.022201 | 0.027155 | 0.022284 |
Testing logistic regression
[5]:
##Create a logistic regression dataset using strings that will later be converted to zeros and ones
test_pheno_data = ["fetal","fetal","fetal","adult","adult","adult"]
[38]:
test_M_values_T = m_values.transpose()
test_M_values_T.shape
[38]:
(6, 485512)
[8]:
##Run a logistic regression on the methylation data, testing a random 30000 probes only here
test_results = diff_meth_pos(test_M_values_T.sample(3000, axis=1), #.iloc[:,64000:67000],
                                  test_pheno_data,
                                  regression_method="logistic",
                            export=False)
Additional parameters: {'export': True}
All samples with the phenotype (adult) were assigned a value of 0 and all samples with the phenotype (fetal) were assigned a value of 1 for the logistic regression analysis.
181 probes failed the logistic regression analysis due to perfect separation and could not be included in the final results.
1 probes failed the logistic regression analysis due to encountering a LinAlgError: Singular matrix and could not be included in the final results.
Probes with LinAlgError:
cg16723381
saved DMP_2818_6_2019-11-04.
Testing Manhattan plot visualizations
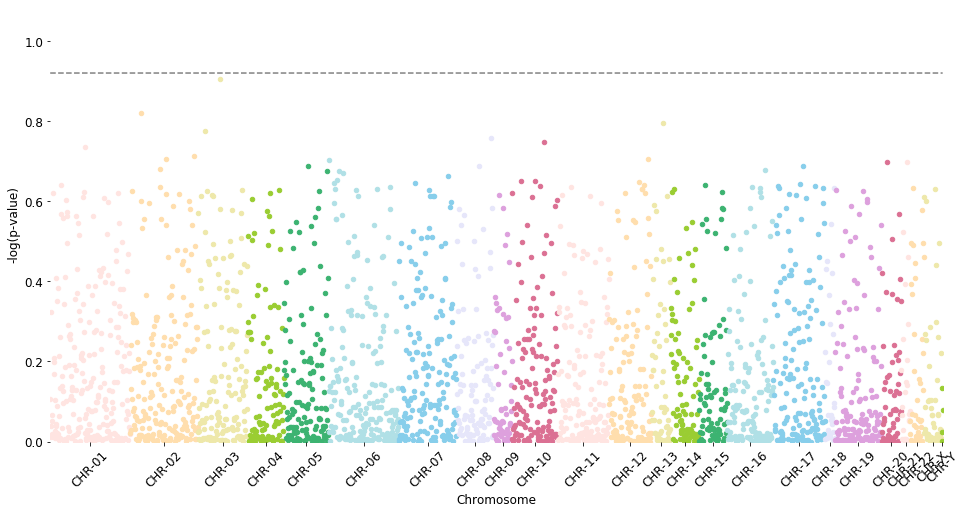
[23]:
manhattan_plot(test_results, cutoff=0.12, palette='default', save=False) # , label_prefix='')
Total probes to plot: 2644
CHR-01 237 | CHR-02 201 | CHR-03 147 | CHR-04 107 | CHR-05 133 | CHR-06 207 | CHR-07 172 | CHR-08 109 | CHR-09 55 | CHR-10 136 | CHR-11 151 | CHR-12 126 | CHR-13 56 | CHR-14 84 | CHR-15 84 | CHR-16 137 | CHR-17 153 | CHR-18 29 | CHR-19 138 | CHR-20 59 | CHR-21 25 | CHR-22 42 | CHR-X 52 | CHR-Y 4
p-value line: 0.9208187539523752
[10]:
""" pvalues: diff bw the two phenotype labels (A vs B difference sig)
most p-values in the demo data are not near or below 0.05.
That means those probes / locations are not useful in separating the two phenotypes
"""
interesting_probes = test_results[test_results['PValue'] <= 0.13]
interesting_probes
[10]:
| Coefficient | StandardError | PValue | 95%CI_lower | 95%CI_upper | FDR_QValue | minuslog10pvalue | chromosome | |
|---|---|---|---|---|---|---|---|---|
| cg13537646 | -3.634417 | 2.364558 | 0.124284 | -8.268866 | 1.000031 | 0.999967 | 0.905585 | 03 |
Testing linear regression
[24]:
# usually you would pull this data from methylprep meta_data dataframe
# Create a linear regression dataset using strings that will be coerced to numbers (adult ages are estimates, not exact)
test_pheno_data2 = ["0","0","0","52","54","57"]
[26]:
# Run a linear regression on the methylation data versus age of sample
test_results2 = diff_meth_pos(test_M_values_T.sample(60000, axis=1), #.iloc[:,:], # ALL probes. slow!
                              test_pheno_data2,
                              regression_method="linear")
[27]:
interesting_probes = test_results2[test_results2['PValue'] <= 0.05]
print(len(interesting_probes))
interesting_probes.head()
12975
[27]:
| Coefficient | StandardError | PValue | 95%CI_lower | 95%CI_upper | FDR_QValue | |
|---|---|---|---|---|---|---|
| cg23165623 | -0.089640 | 0.000837 | 1.342041e-09 | -0.091790 | -0.087490 | 0.000081 |
| cg00088844 | -0.067228 | 0.000762 | 3.536345e-09 | -0.069186 | -0.065270 | 0.000106 |
| cg01093363 | -0.063621 | 0.000880 | 9.600144e-09 | -0.065883 | -0.061358 | 0.000192 |
| cg01721754 | -0.073975 | 0.001235 | 2.454493e-08 | -0.077150 | -0.070801 | 0.000305 |
| cg18768347 | 0.090029 | 0.001570 | 3.048514e-08 | 0.085994 | 0.094064 | 0.000305 |
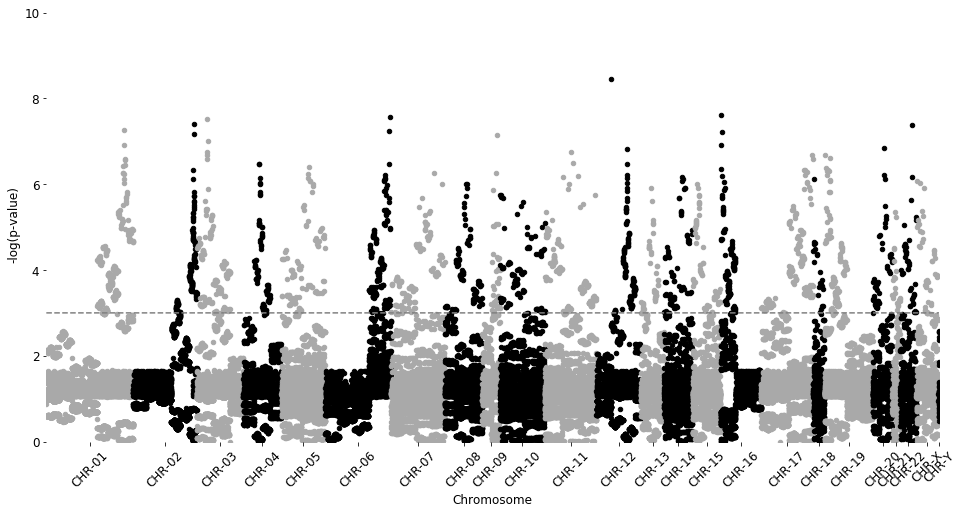
[30]:
manhattan_plot(test_results2, cutoff=0.001, palette='Gray3', save=False)
Total probes to plot: 56286
CHR-01 5481 | CHR-02 4000 | CHR-03 2940 | CHR-04 2405 | CHR-05 2767 | CHR-06 4148 | CHR-07 3383 | CHR-08 2364 | CHR-09 1127 | CHR-10 2808 | CHR-11 3261 | CHR-12 2808 | CHR-13 1460 | CHR-14 1790 | CHR-15 1761 | CHR-16 2559 | CHR-17 3289 | CHR-18 709 | CHR-19 3043 | CHR-20 1236 | CHR-21 503 | CHR-22 1014 | CHR-X 1389 | CHR-Y 41
p-value line: 3.0
Testing Volcano plot visualizations
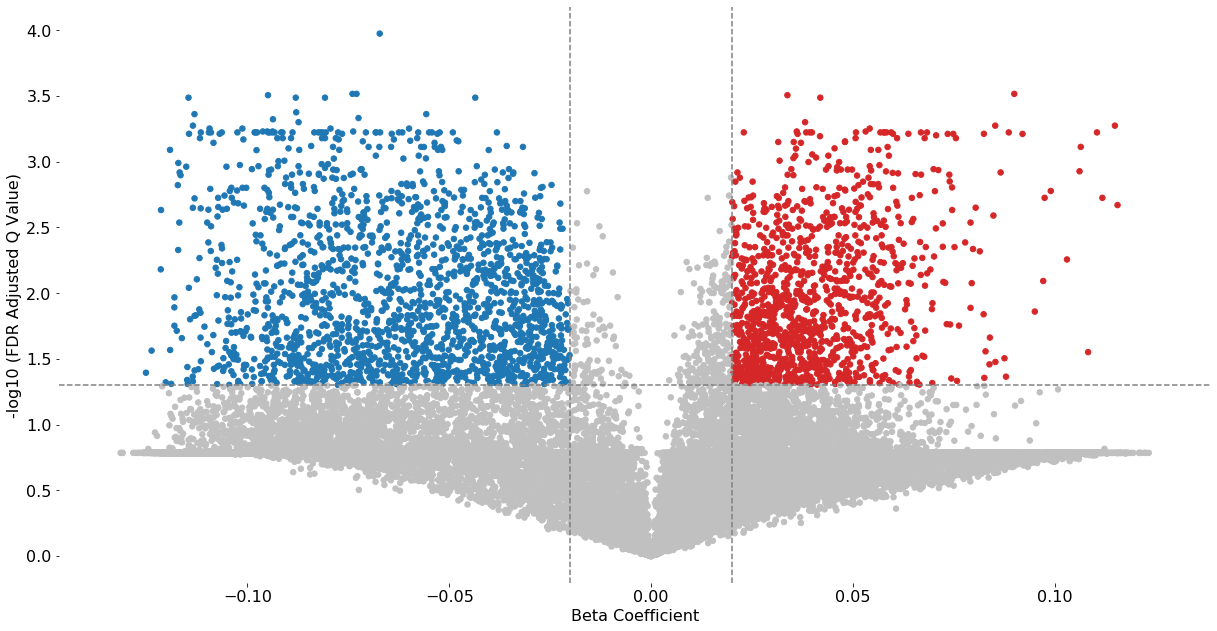
[37]:
volcano_plot(test_results2, fontsize=16, cutoff=0.05, beta_coefficient_cutoff=(-0.02,0.02), save=False)
Excluded 8878 probes outside of the specified beta coefficient range: (-0.02, 0.02)
[ ]: